
MONITORING / OBSERVABILITY
UPnator
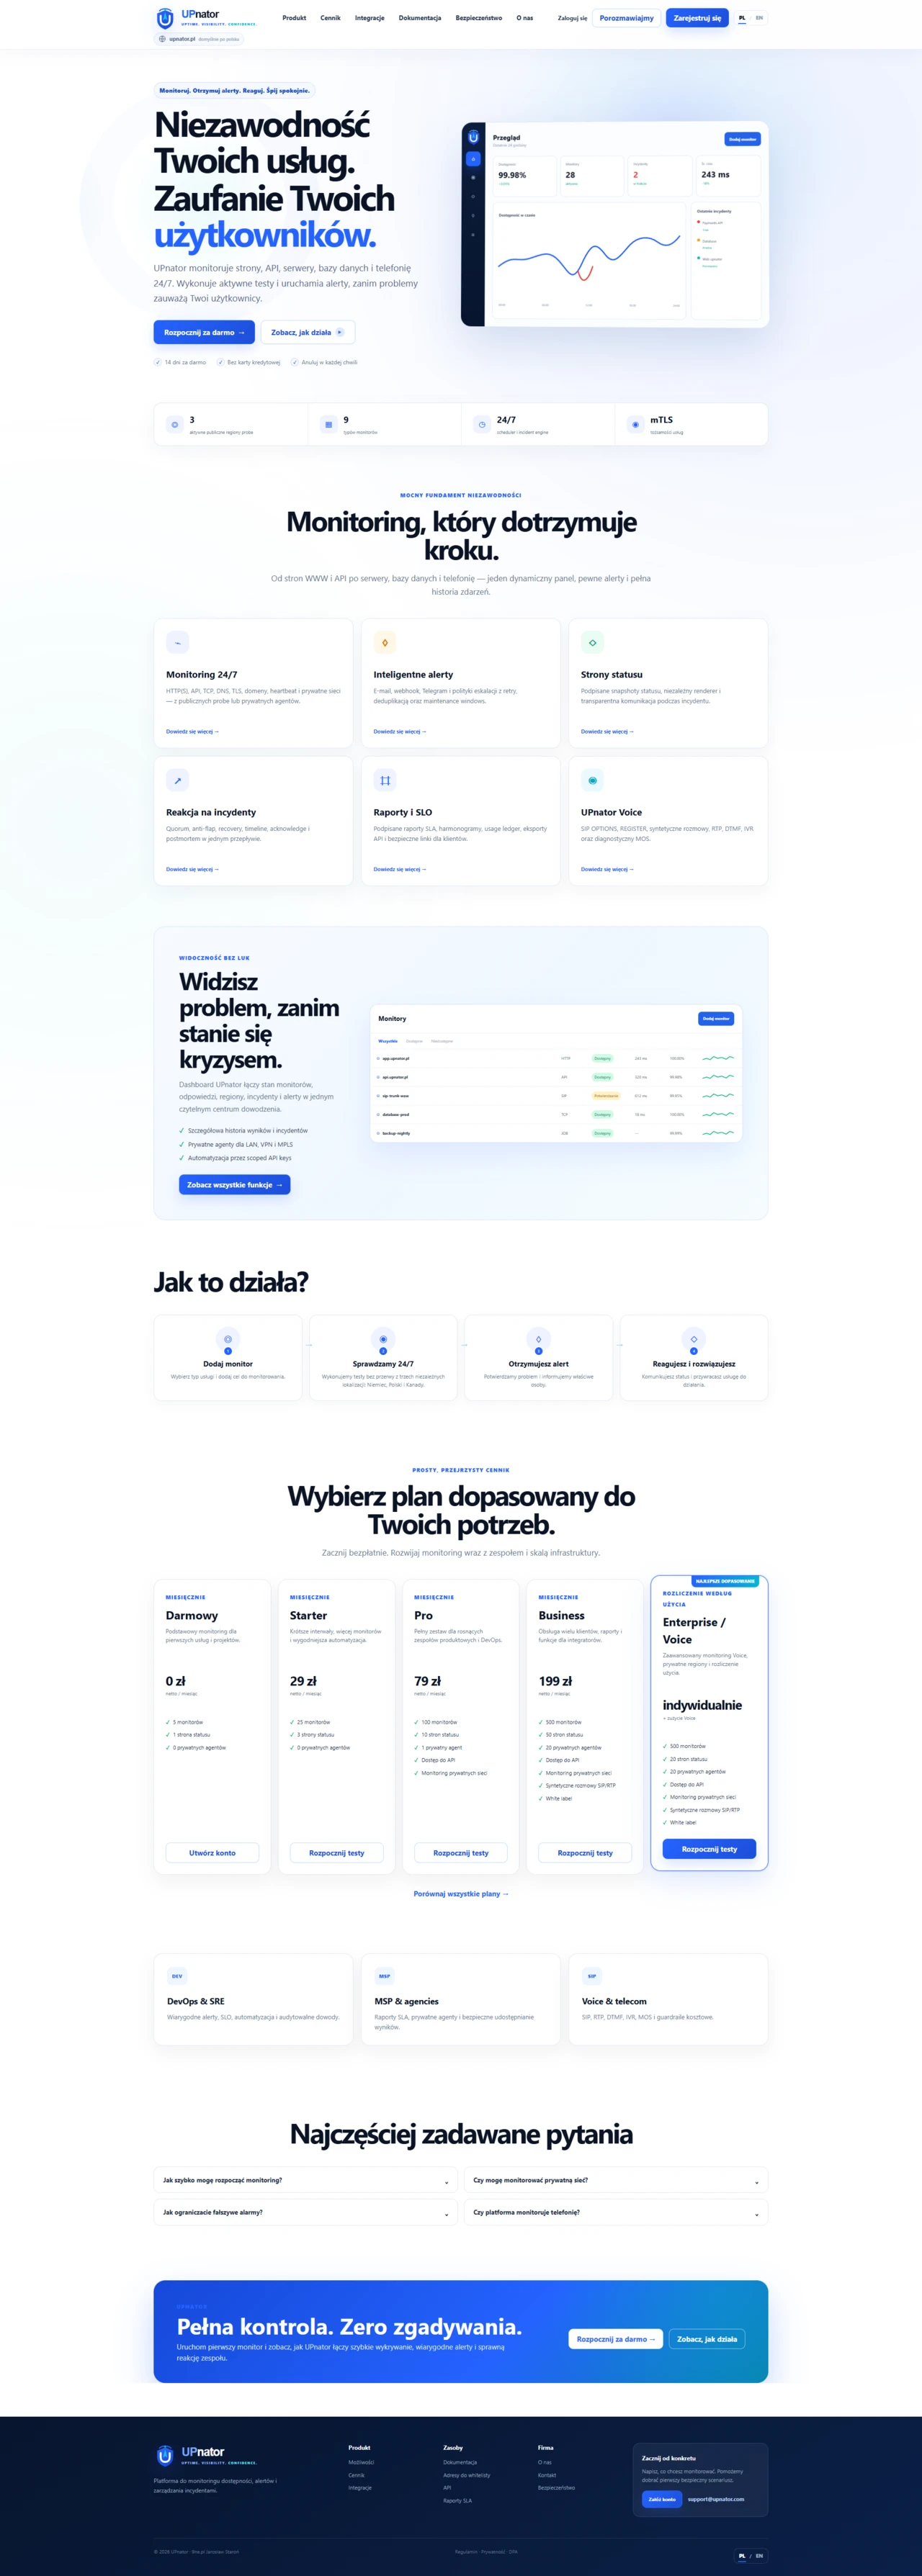
A monitoring and reliability platform for websites, APIs, servers, databases and telephony, with alerts, status pages, incident history and SLO reports.
- Product
- Monitoring SaaS
- Model
- Multi-tenant
- Focus
- Uptime + alerts
THE CHALLENGE
Detect a problem before it becomes an incident users can see.
Monitoring must cover more than a simple website ping. Users need checks for HTTP and APIs, servers, databases, certificates, dependencies and telephony, and each type of test has different success criteria.
Detecting an error is not enough. The platform must reduce noise, maintain event history, send alerts through the right channel and show external audiences a clear service status.
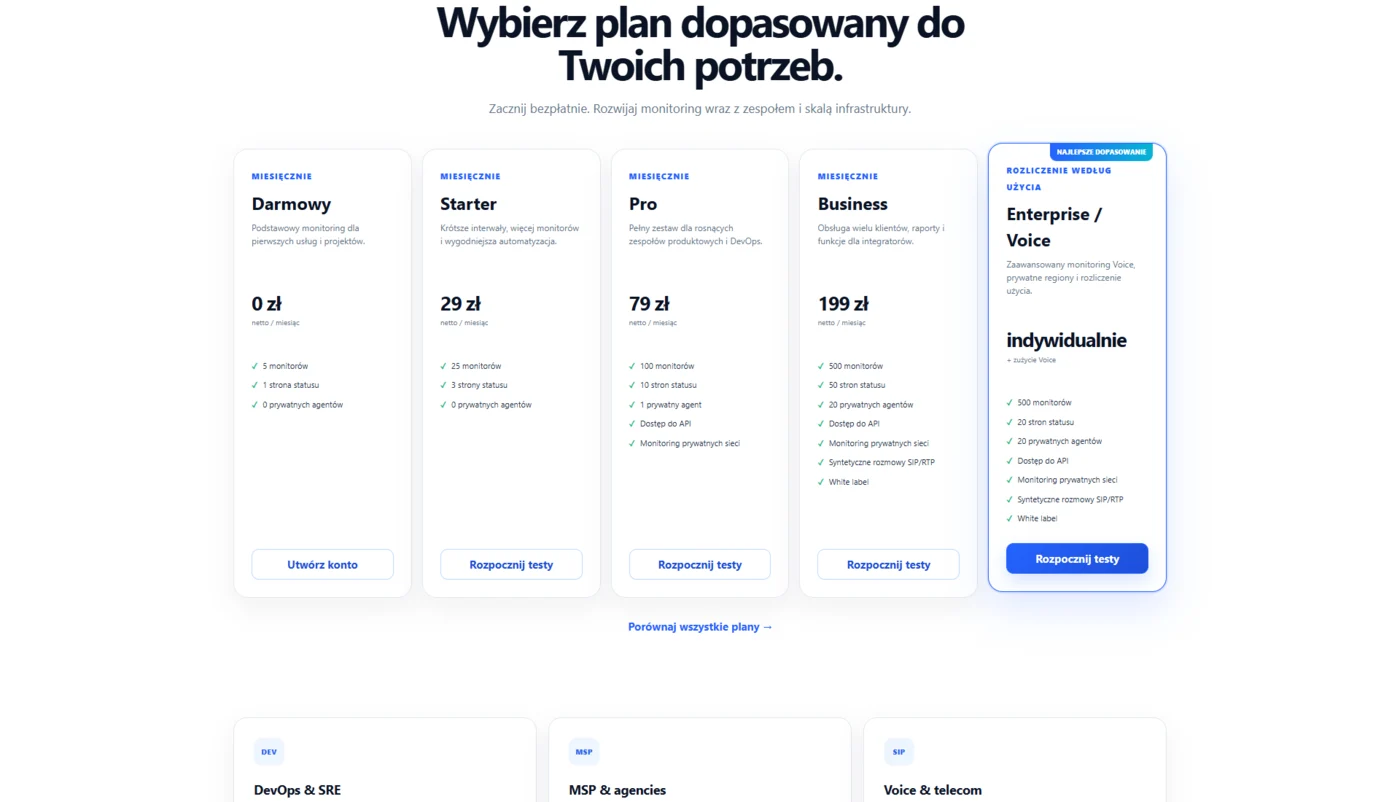
The product was designed for several scales, from free monitoring of individual services to DevOps, MSP and voice/telecom needs, while keeping the initial setup straightforward.
Provide one system for monitoring services, intelligent alerting, publishing status and measuring reliability, without manually assembling multiple tools.
SCOPE AND DECISIONS
What was designed, and why.
The functional scope is presented alongside decisions that affect everyday use and future product development.
- 01
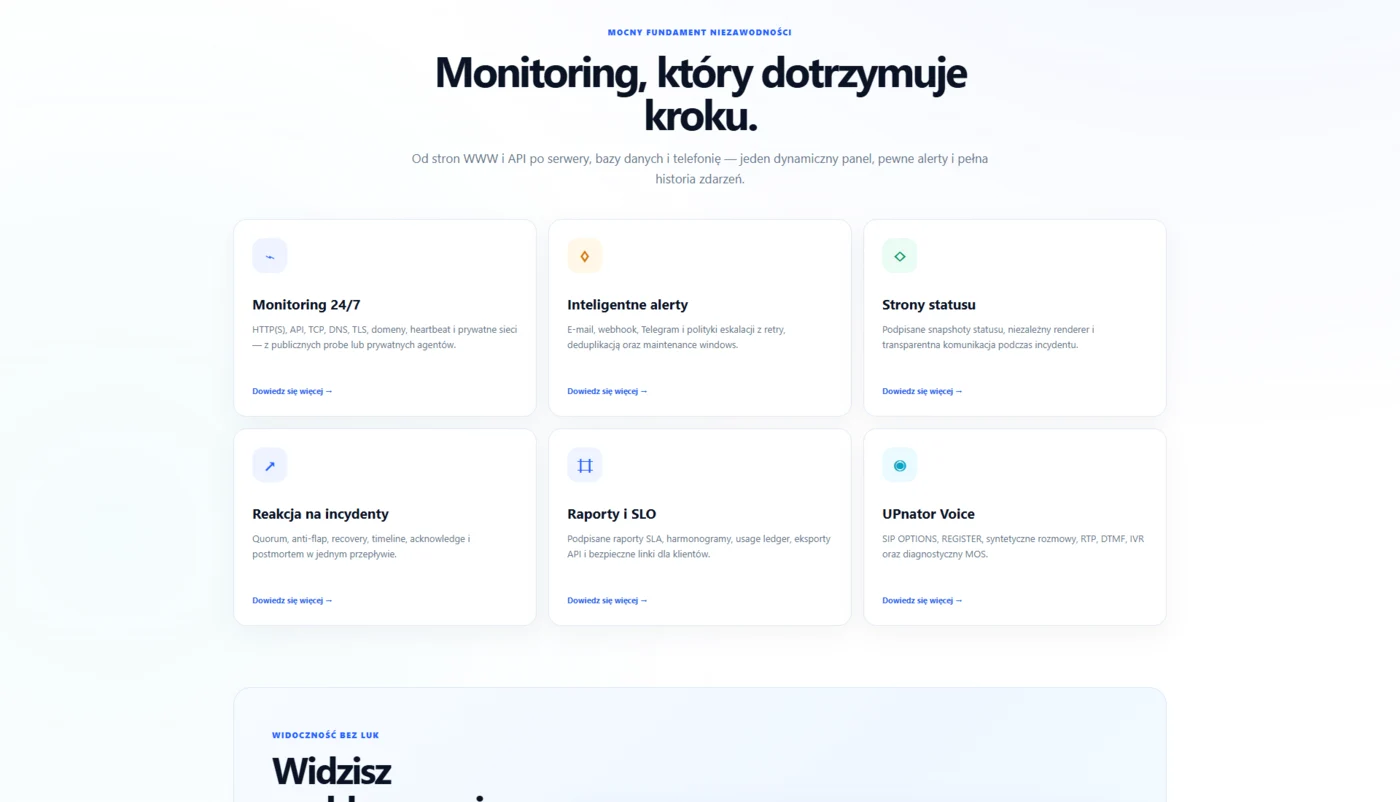
Monitors for HTTP, APIs, TCP, DNS, TLS, servers, databases and internal services.
- 02
A scheduler, distributed tests, result history and state-change detection.
- 03
Email alerts, webhooks, integrations and false-alarm reduction.
- 04
Public status pages, incidents, maintenance and audience communication.
- 05
SLA/SLO reports, voice/SIP monitoring and tiered SaaS plans.
Monitoring as the foundation
Every result retains its history and context, so alerts, status and SLO reports use the same data source.
Alerts after confirmation
Confirmation mechanisms and state rules reduce notifications caused by a single isolated failure.
Status as part of the product
Public incident and maintenance communication is connected to monitoring, while remaining under the operator's control.
Voice and telecom specialisation
SIP, RTP and voice scenario monitoring are treated as a full area of the product alongside standard web tests.
ARCHITECTURE
Product layers and their responsibilities.
The architecture is described in functional terms to make clear where logic, data, integrations and operations belong.
- 01
SaaS panel → monitors, teams, alerts, reports and status pages.
- 02
Scheduler → scheduling checks and distributing tasks to workers.
- 03
Probe runners → HTTP/API/TCP/DNS/TLS, infrastructure and voice tests.
- 04
Event pipeline → result normalisation, state changes and alert deduplication.
- 05
Reporting layer → incidents, SLOs, history, status and reliability forecasts.
SELECTED SCREENS
The interface as part of the whole process.
The screenshots show the appearance and how users are guided through the main tasks.
OUTCOME
What the project delivered.
Specific product, process and deployment capabilities delivered by the project, without invented metrics.
- One platform for monitoring web services, infrastructure and telephony.
- Alerts, incidents, status pages and SLOs based on a shared event model.
- A clear path from a free account to DevOps, MSP and telecom requirements.
- An interface that highlights problems and trends without overwhelming users with raw metrics.
- A foundation for private agents, distributed tests and further response automation.
NEXT PROJECT
Psycholog Spektrum
A psychology practice website combining a calm presentation of its services, appointment booking, contact forms and tools for everyday administration.